OneQode Japan Tokyo Latency Optimized High Performance Cloud Server Test and Review

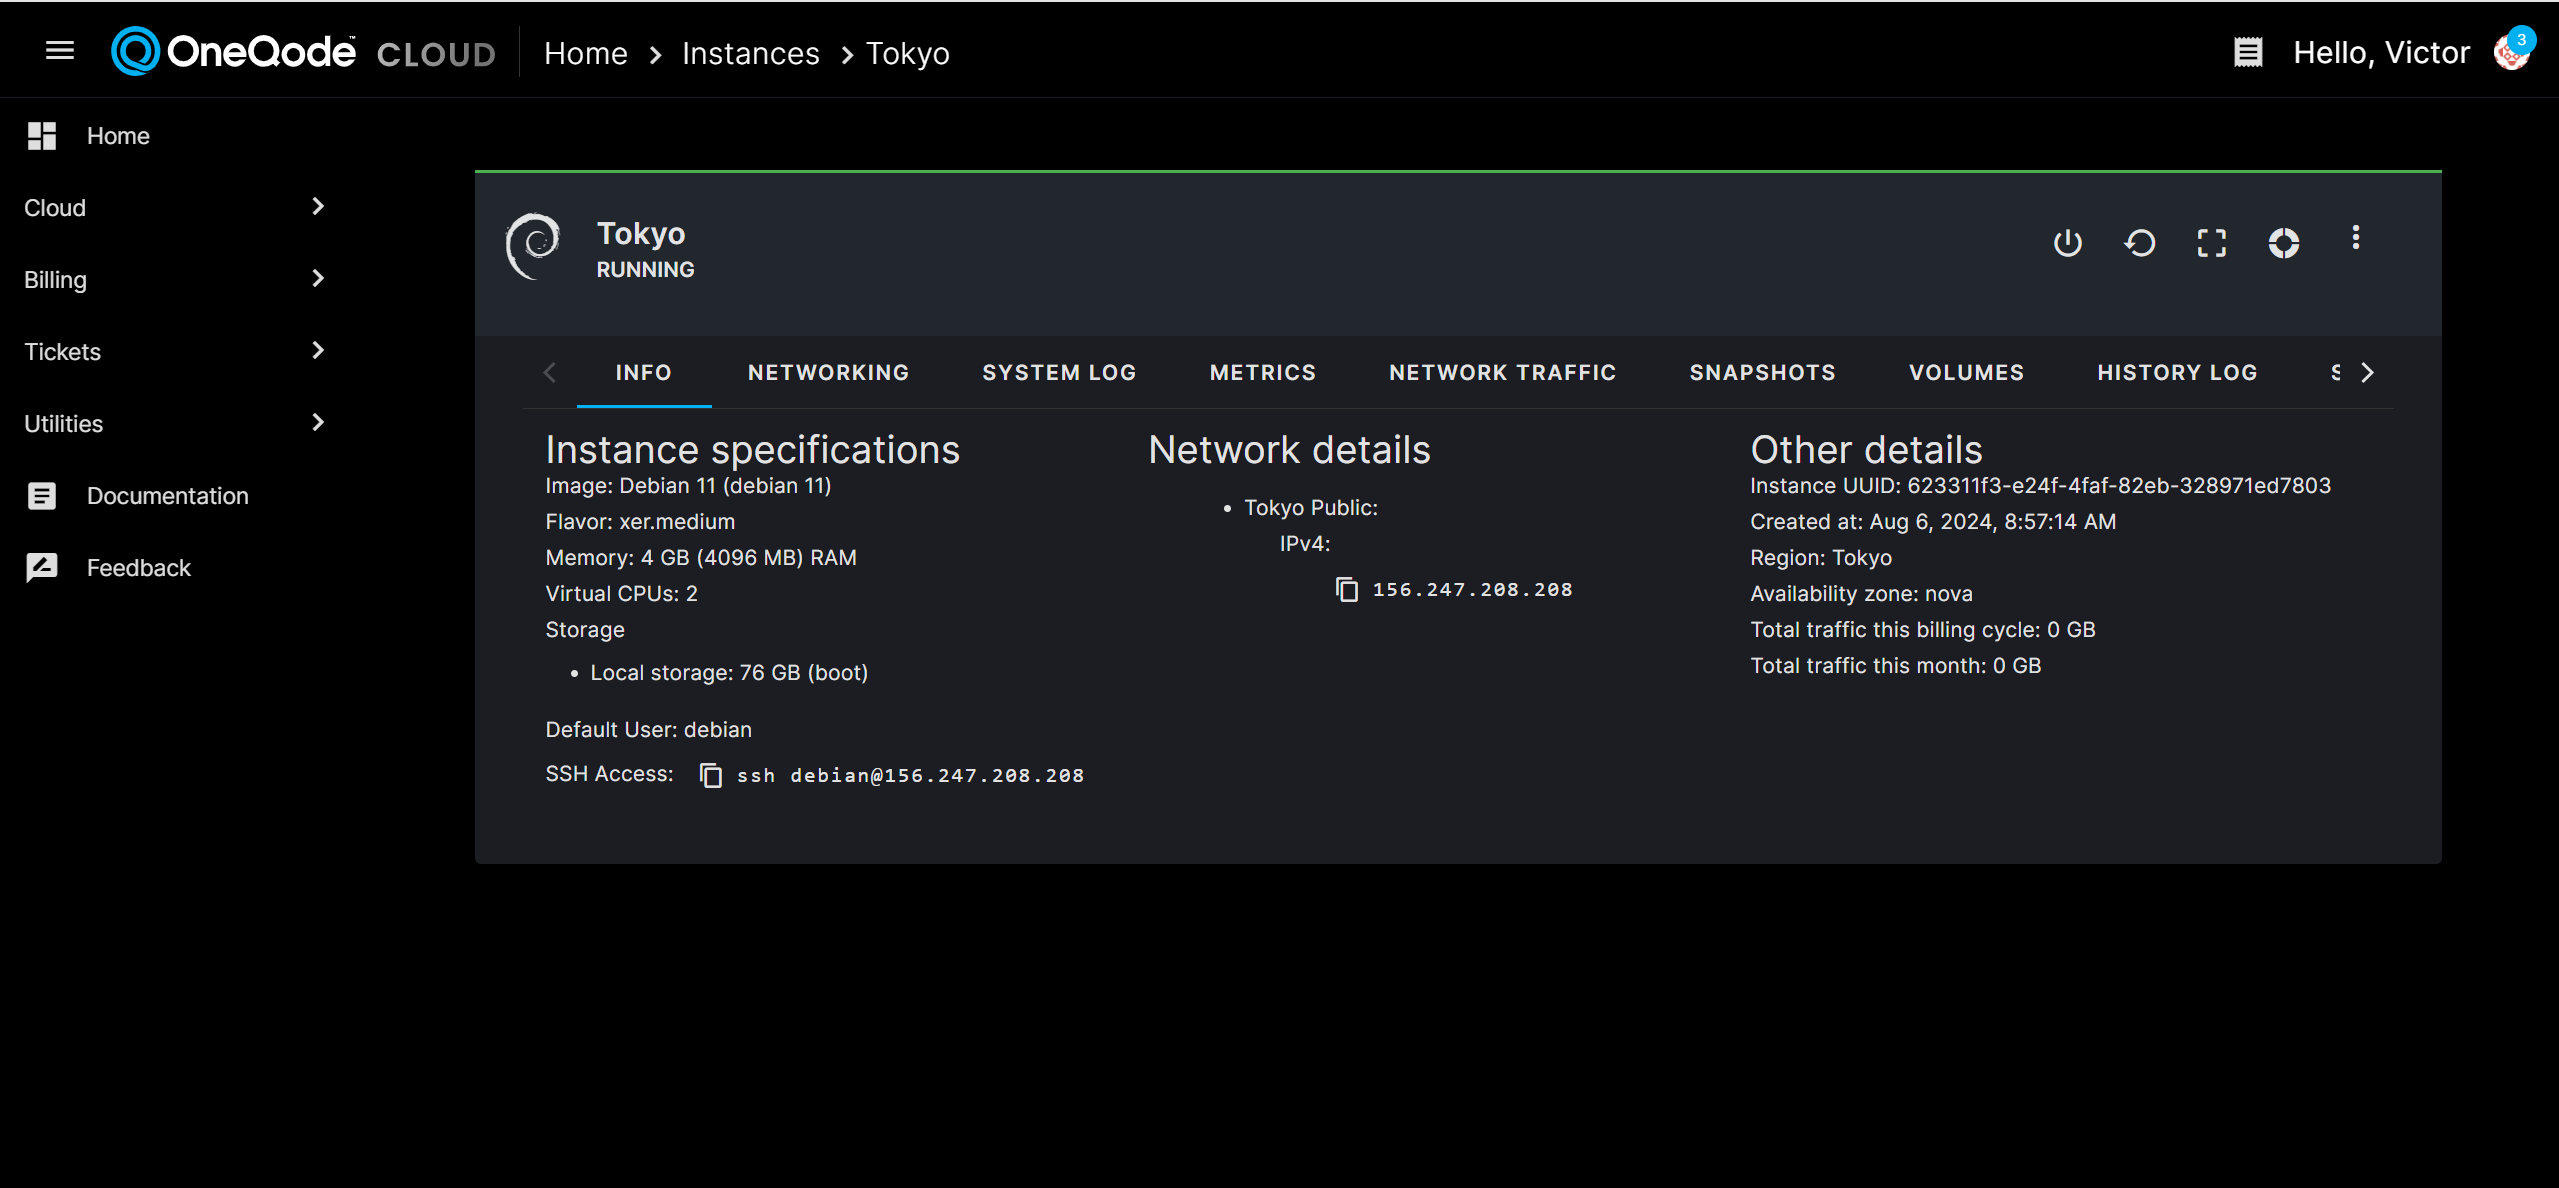
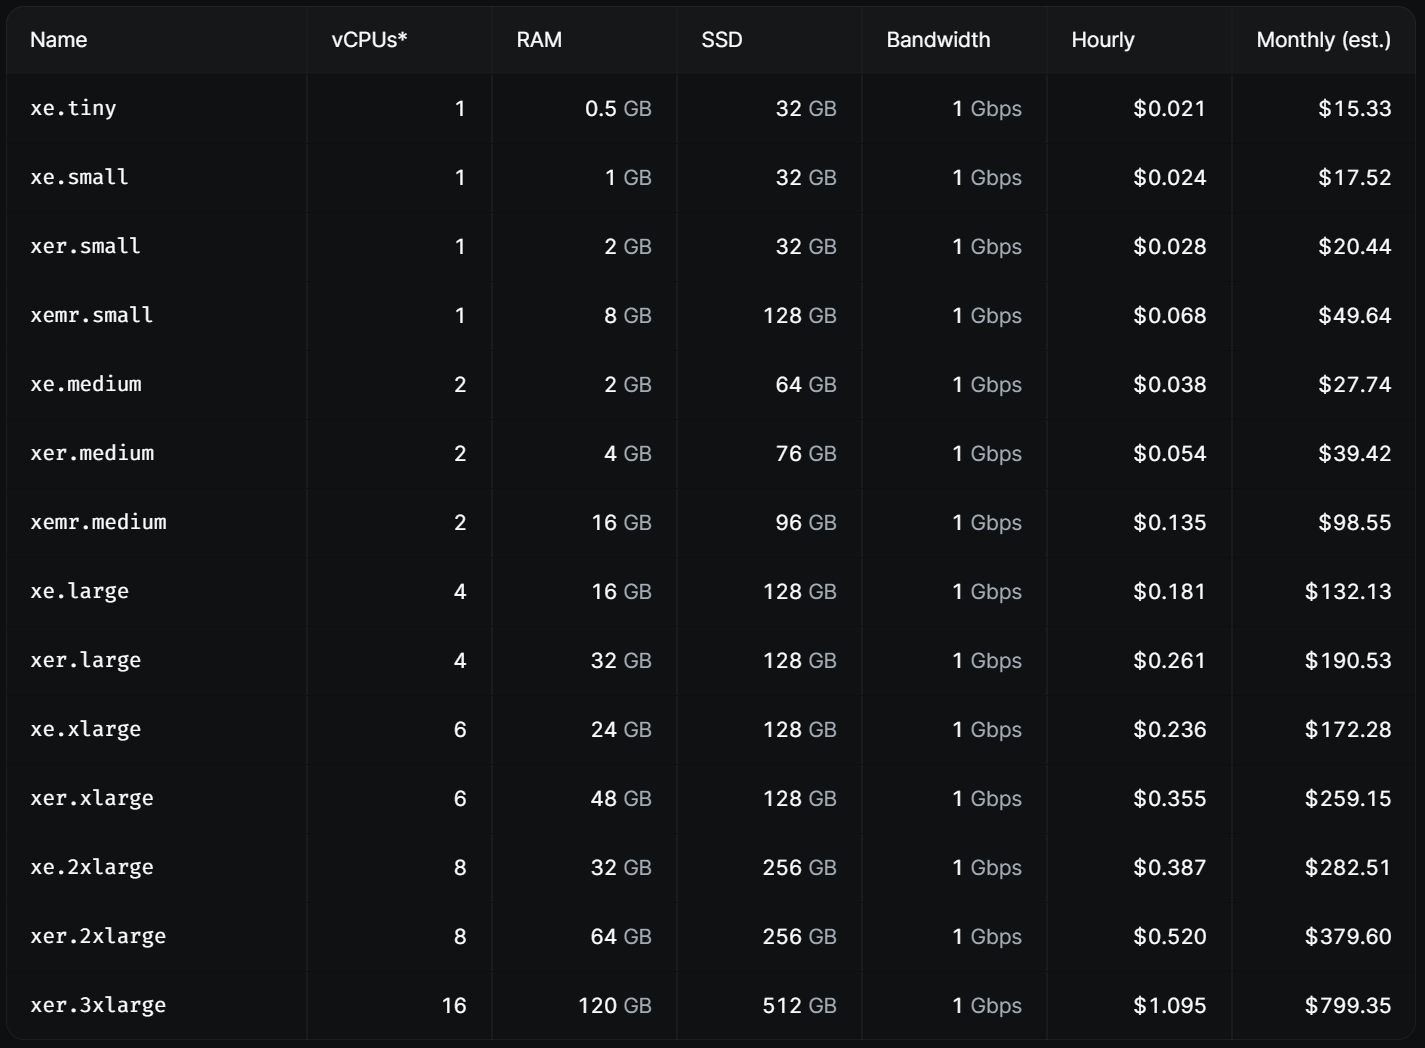
We recently tested the OneQode Japan Tokyo Latency Optimized High-Performance Cloud Server (Plan: xer.medium). It runs on an Intel Core Processor (Skylake, IBRS) with 2 CPU cores, 4 GB RAM, 76 GB SSD storage, a 1 Gbps internet port, and one IPv4 address.
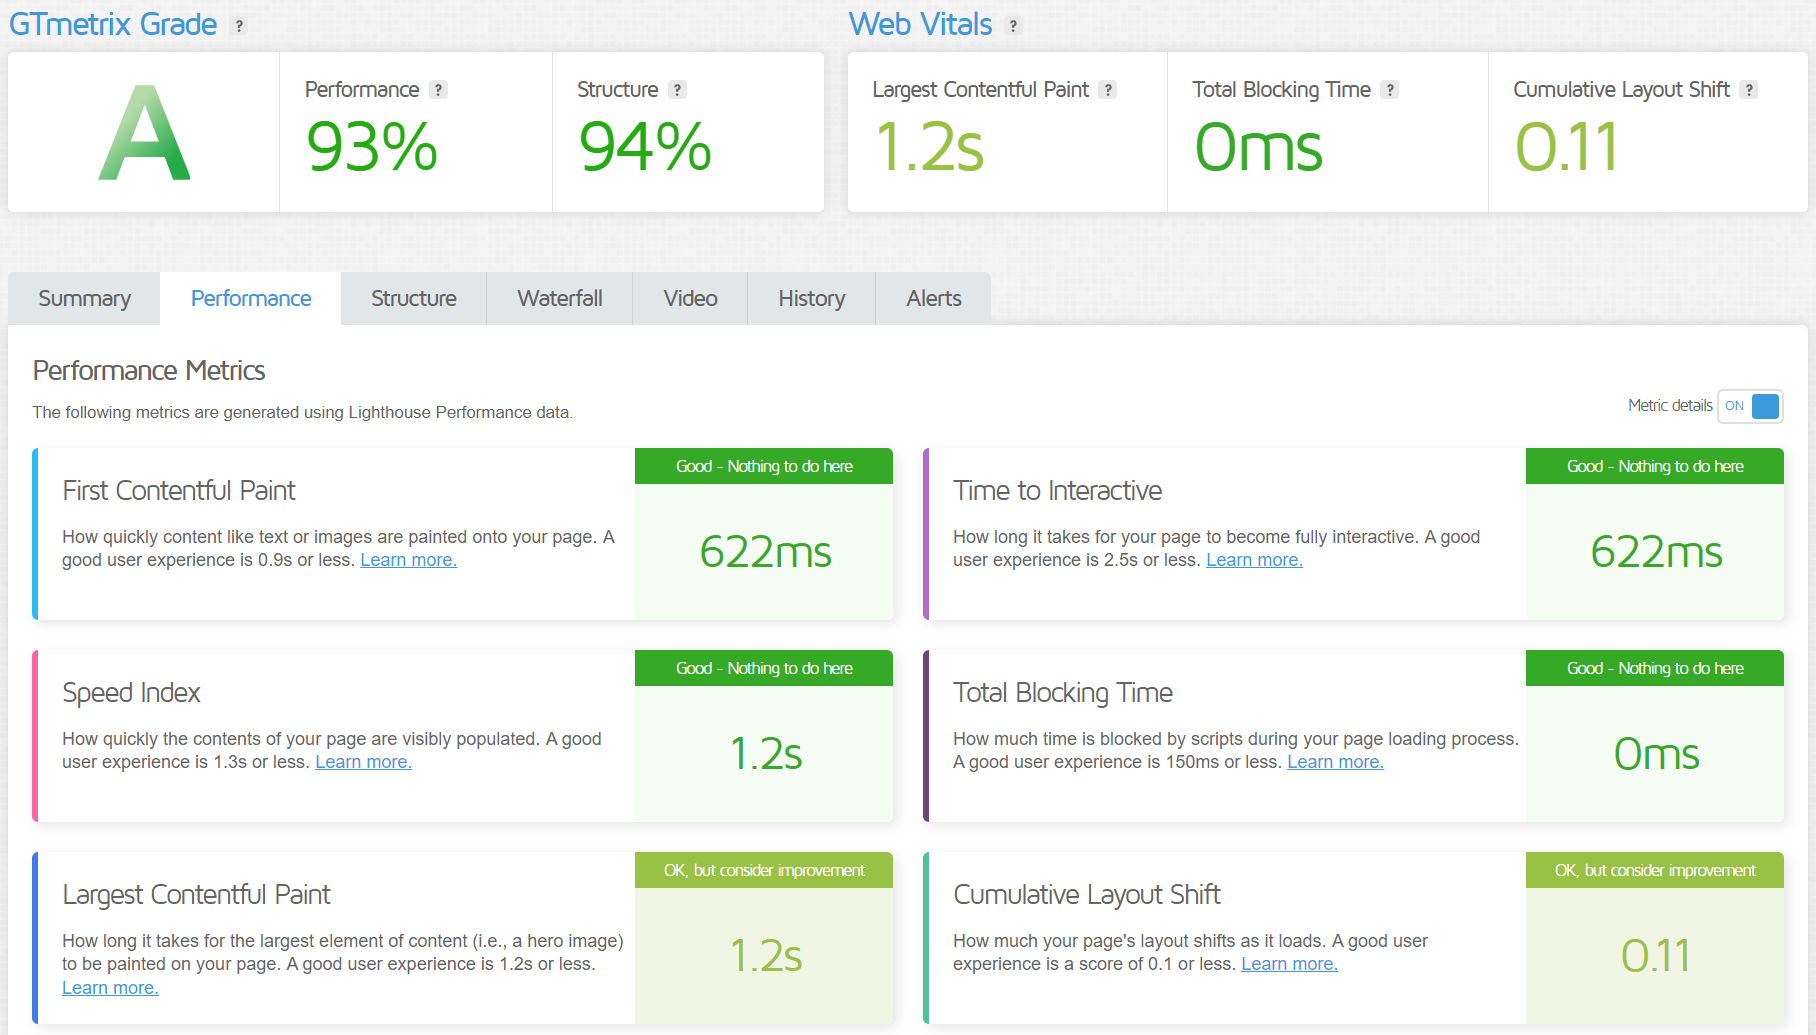
Our review covered several tests: Basic Benchmark, Yabs, and Unix Benchmark for performance, Global Node Test for network speeds in different locations, and Global Ping Test for latency. We also checked media accessibility with The Media Unlock Test, connection quality with the CloudFlare Internet Test, and web performance using PageSpeed Insights and GTmetrix.
About OneQode
OneQode operates its network, ensuring that no third party carries its traffic. This approach minimizes hops and shortens routes, resulting in minimal lag and real-time performance. The network’s design focuses on delivering data as close to real-time as possible, making it ideal for applications that require instant response times.
High-Performance Computing
OneQode’s cloud platform leverages the world’s fastest CPUs, unleashing the full potential of your services. With high clock speed and zero overprovisioning, OneQode ensures peak compute performance. The cloud instances use Intel® Xeon® processors operating at 3.7 GHz or higher, providing robust performance for even the most demanding applications.
Flexible Solutions
OneQode offers a range of flexible Infrastructure as a Service (IaaS) solutions across its Asia-Pacific data centers. Whether you need dedicated servers, colocation, or custom hardware deployments, OneQode has you covered. The company provides tailored infrastructure built from the ground up, ensuring your needs are met.
Low Latency Network
OneQode’s low-latency network is a game-changer for gaming, high-frequency trading, and real-time applications. The network’s design minimizes hops and shortens routes, ensuring data travels the shortest possible distance. This results in minimal lag and near-instantaneous data delivery.
DDoS Protection
In today’s digital landscape, security is paramount. OneQode offers in-line, zero-latency DDoS protection to keep your systems online and secure. This protection is always on and requires zero configuration, providing peace of mind for businesses that rely on uninterrupted service.
Official Website: https://www.OneQode.com
BasicBench: Server Profile, I/O Speed, Upload and Download Speed
 CPU Model          : Intel Core Processor (Skylake, IBRS)
 CPU Cores          : 2 @ 3696.000 MHz
 CPU Cache          : 16384 KB
 AES-NI             : ✓ Enabled
 VM-x/AMD-V         : ✓ Enabled
 Total Disk         : 150.7 GB (1.4 GB Used)
 Total Mem          : 3.8 GB (223.5 MB Used)
 System uptime      : 0 days, 0 hour 47 min
 Load average       : 0.00, 0.01, 0.06
 OS                 : Debian GNU/Linux 11
 Arch               : x86_64 (64 Bit)
 Kernel             : 5.10.0-26-cloud-amd64
 TCP CC             :
 Virtualization     : Dedicated
 IPv4/IPv6          : ✓ Online / ✗ Offline
 Organization       : AS140627 OneQode
 Location           : Tokyo / JP
 Region             : Tokyo
----------------------------------------------------------------------
 I/O Speed(1st run) : 110 MB/s
 I/O Speed(2nd run) : 110 MB/s
 I/O Speed(3rd run) : 111 MB/s
 I/O Speed(average) : 110.3 MB/s
----------------------------------------------------------------------
 Node Name        Upload Speed      Download Speed      Latency
 Speedtest.net    787.29 Mbps       723.77 Mbps         85.11 ms
 Los Angeles, US  595.03 Mbps       915.00 Mbps         138.37 ms
 Dallas, US       492.59 Mbps       896.29 Mbps         166.24 ms
 Montreal, CA     387.47 Mbps       924.73 Mbps         204.67 ms
 Amsterdam, NL    246.33 Mbps       663.93 Mbps         245.00 ms
 Chongqing, CN    7.21 Mbps         0.37 Mbps           143.01 ms
 Hongkong, CN     902.94 Mbps       939.82 Mbps         46.57 ms
 Mumbai, IN       551.48 Mbps       933.12 Mbps         144.48 ms
 Singapore, SG    213.75 Mbps       62.53 Mbps          94.45 ms
 Tokyo, JP        871.77 Mbps       941.19 Mbps         45.34 ms
----------------------------------------------------------------------
 Finished in        : 5 min 38 sec
 Timestamp          : 2024-08-06 01:50:46 UTC
YabsBench: Disk Speed, iperf3 Network Speed, Geekbench 6 Benchmark
Basic System Information:
---------------------------------
Uptime     : 0 days, 0 hours, 53 minutes
Processor  : Intel Core Processor (Skylake, IBRS)
CPU cores  : 2 @ 3696.000 MHz
AES-NI     : ✔ Enabled
VM-x/AMD-V : ✔ Enabled
RAM        : 3.8 GiB
Swap       : 0.0 KiB
Disk       : 150.7 GiB
Distro     : Debian GNU/Linux 11 (bullseye)
Kernel     : 5.10.0-26-cloud-amd64
VM Type    : KVM
IPv4/IPv6  : ✔ Online / ❌ Offline

IPv4 Network Information:
---------------------------------
ISP        : Oneqode Assets PTY LTD
ASN        : AS140627 OneQode
Host       : OneQode Assets Pty Ltd
Location   : Singapore, North West (03)
Country    : Singapore

fio Disk Speed Tests (Mixed R/W 50/50):
---------------------------------
Block Size | 4k            (IOPS) | 64k           (IOPS)
  ------   | ---            ----  | ----           ----
Read       | 53.53 MB/s   (13.3k) | 108.44 MB/s   (1.6k)
Write      | 53.64 MB/s   (13.4k) | 109.01 MB/s   (1.7k)
Total      | 107.17 MB/s  (26.7k) | 217.46 MB/s   (3.3k)
           |                      |
Block Size | 512k          (IOPS) | 1m            (IOPS)
  ------   | ---            ----  | ----           ----
Read       | 103.42 MB/s    (201) | 100.75 MB/s     (98)
Write      | 108.91 MB/s    (212) | 107.46 MB/s    (104)
Total      | 212.33 MB/s    (413) | 208.22 MB/s    (202)

iperf3 Network Speed Tests (IPv4):
---------------------------------
Provider        | Location (Link)           | Send Speed      | Recv Speed      | Ping
Clouvider       | London, UK (10G)          | busy            | 185 Mbits/sec   | 360 ms
Eranium         | Amsterdam, NL (100G)      | 456 Mbits/sec   | 524 Mbits/sec   | 284 ms
Uztelecom       | Tashkent, UZ (10G)        | 647 Mbits/sec   | 320 Mbits/sec   | 217 ms
Leaseweb        | Singapore, SG (10G)       | 865 Mbits/sec   | 721 Mbits/sec   | 94.2 ms
Clouvider       | Los Angeles, CA, US (10G) | 787 Mbits/sec   | 537 Mbits/sec   | 138 ms
Leaseweb        | NYC, NY, US (10G)         | 690 Mbits/sec   | 732 Mbits/sec   | 201 ms
Edgoo           | Sao Paulo, BR (1G)        | 449 Mbits/sec   | 268 Mbits/sec   | 279 ms

Geekbench 6 Benchmark Test:
---------------------------------
Test            | Value
                |
Single Core     | 1653
Multi Core      | 2926
Full Test       | https://browser.geekbench.com/v6/cpu/7210969

YABS completed in 13 min 14 sec
UnixBench: CPU Performance, A Score Higher is Better
Benchmark Run: Tue Aug 06 2024 02:10:59 - 02:39:01
2 CPUs in system; running 1 parallel copy of tests

Dhrystone 2 using register variables       59124558.3 lps   (10.0 s, 7 samples)
Double-Precision Whetstone                     9183.3 MWIPS (9.8 s, 7 samples)
Execl Throughput                               6023.7 lps   (29.8 s, 2 samples)
File Copy 1024 bufsize 2000 maxblocks       1436126.3 KBps  (30.0 s, 2 samples)
File Copy 256 bufsize 500 maxblocks          415133.0 KBps  (30.0 s, 2 samples)
File Copy 4096 bufsize 8000 maxblocks       3616033.7 KBps  (30.0 s, 2 samples)
Pipe Throughput                             3050241.4 lps   (10.0 s, 7 samples)
Pipe-based Context Switching                 240617.3 lps   (10.0 s, 7 samples)
Process Creation                              13090.9 lps   (30.0 s, 2 samples)
Shell Scripts (1 concurrent)                  16496.6 lpm   (60.0 s, 2 samples)
Shell Scripts (8 concurrent)                   3107.7 lpm   (60.0 s, 2 samples)
System Call Overhead                        3394358.0 lps   (10.0 s, 7 samples)

System Benchmarks Index Values               BASELINE       RESULT    INDEX
Dhrystone 2 using register variables         116700.0   59124558.3   5066.4
Double-Precision Whetstone                       55.0       9183.3   1669.7
Execl Throughput                                 43.0       6023.7   1400.9
File Copy 1024 bufsize 2000 maxblocks          3960.0    1436126.3   3626.6
File Copy 256 bufsize 500 maxblocks            1655.0     415133.0   2508.4
File Copy 4096 bufsize 8000 maxblocks          5800.0    3616033.7   6234.5
Pipe Throughput                               12440.0    3050241.4   2452.0
Pipe-based Context Switching                   4000.0     240617.3    601.5
Process Creation                                126.0      13090.9   1039.0
Shell Scripts (1 concurrent)                     42.4      16496.6   3890.7
Shell Scripts (8 concurrent)                      6.0       3107.7   5179.4
System Call Overhead                          15000.0    3394358.0   2262.9
                                                                   ========
System Benchmarks Index Score                                        2450.8

------------------------------------------------------------------------
Benchmark Run: Tue Aug 06 2024 02:39:01 - 03:07:01
2 CPUs in system; running 2 parallel copies of tests

Dhrystone 2 using register variables      111962173.3 lps   (10.0 s, 7 samples)
Double-Precision Whetstone                    17797.7 MWIPS (9.9 s, 7 samples)
Execl Throughput                              10731.3 lps   (30.0 s, 2 samples)
File Copy 1024 bufsize 2000 maxblocks       1933169.0 KBps  (30.0 s, 2 samples)
File Copy 256 bufsize 500 maxblocks          496263.0 KBps  (30.0 s, 2 samples)
File Copy 4096 bufsize 8000 maxblocks       5283945.8 KBps  (30.0 s, 2 samples)
Pipe Throughput                             5861025.1 lps   (10.0 s, 7 samples)
Pipe-based Context Switching                 672823.0 lps   (10.0 s, 7 samples)
Process Creation                              26711.6 lps   (30.0 s, 2 samples)
Shell Scripts (1 concurrent)                  23505.6 lpm   (60.0 s, 2 samples)
Shell Scripts (8 concurrent)                   3241.5 lpm   (60.0 s, 2 samples)
System Call Overhead                        5391481.3 lps   (10.0 s, 7 samples)

System Benchmarks Index Values               BASELINE       RESULT    INDEX
Dhrystone 2 using register variables         116700.0  111962173.3   9594.0
Double-Precision Whetstone                       55.0      17797.7   3235.9
Execl Throughput                                 43.0      10731.3   2495.7
File Copy 1024 bufsize 2000 maxblocks          3960.0    1933169.0   4881.7
File Copy 256 bufsize 500 maxblocks            1655.0     496263.0   2998.6
File Copy 4096 bufsize 8000 maxblocks          5800.0    5283945.8   9110.3
Pipe Throughput                               12440.0    5861025.1   4711.4
Pipe-based Context Switching                   4000.0     672823.0   1682.1
Process Creation                                126.0      26711.6   2120.0
Shell Scripts (1 concurrent)                     42.4      23505.6   5543.8
Shell Scripts (8 concurrent)                      6.0       3241.5   5402.5
System Call Overhead                          15000.0    5391481.3   3594.3
                                                                   ========
System Benchmarks Index Score                                        4036.1

======= Script description and score comparison completed! =======
Looking Glass
https://lg.oneqode.com
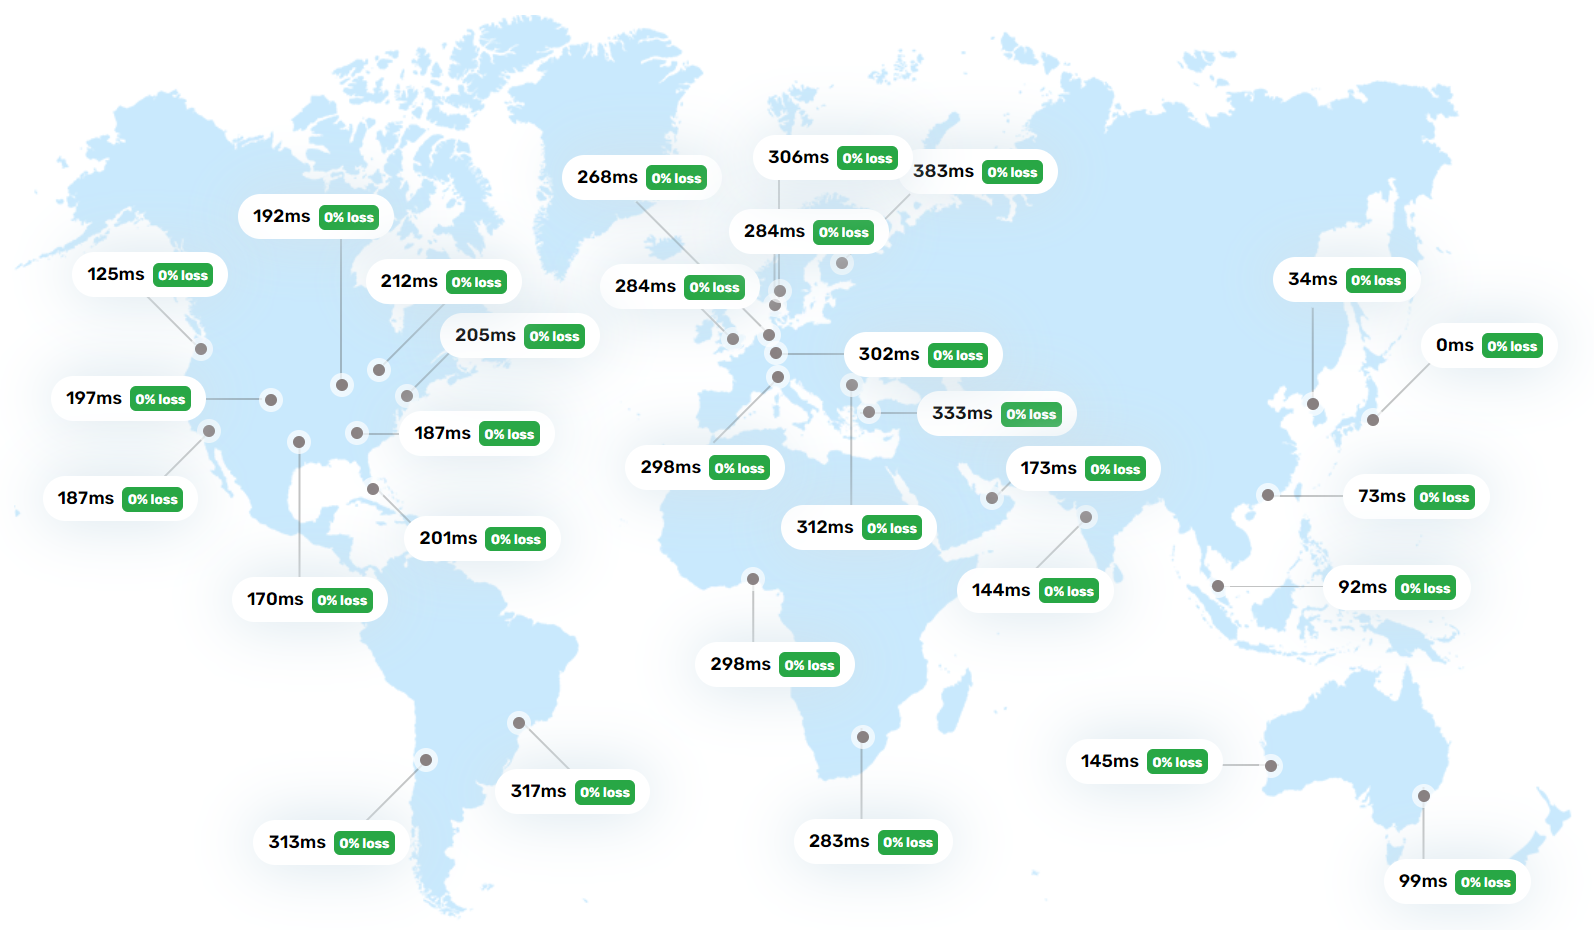
Global Latency Test
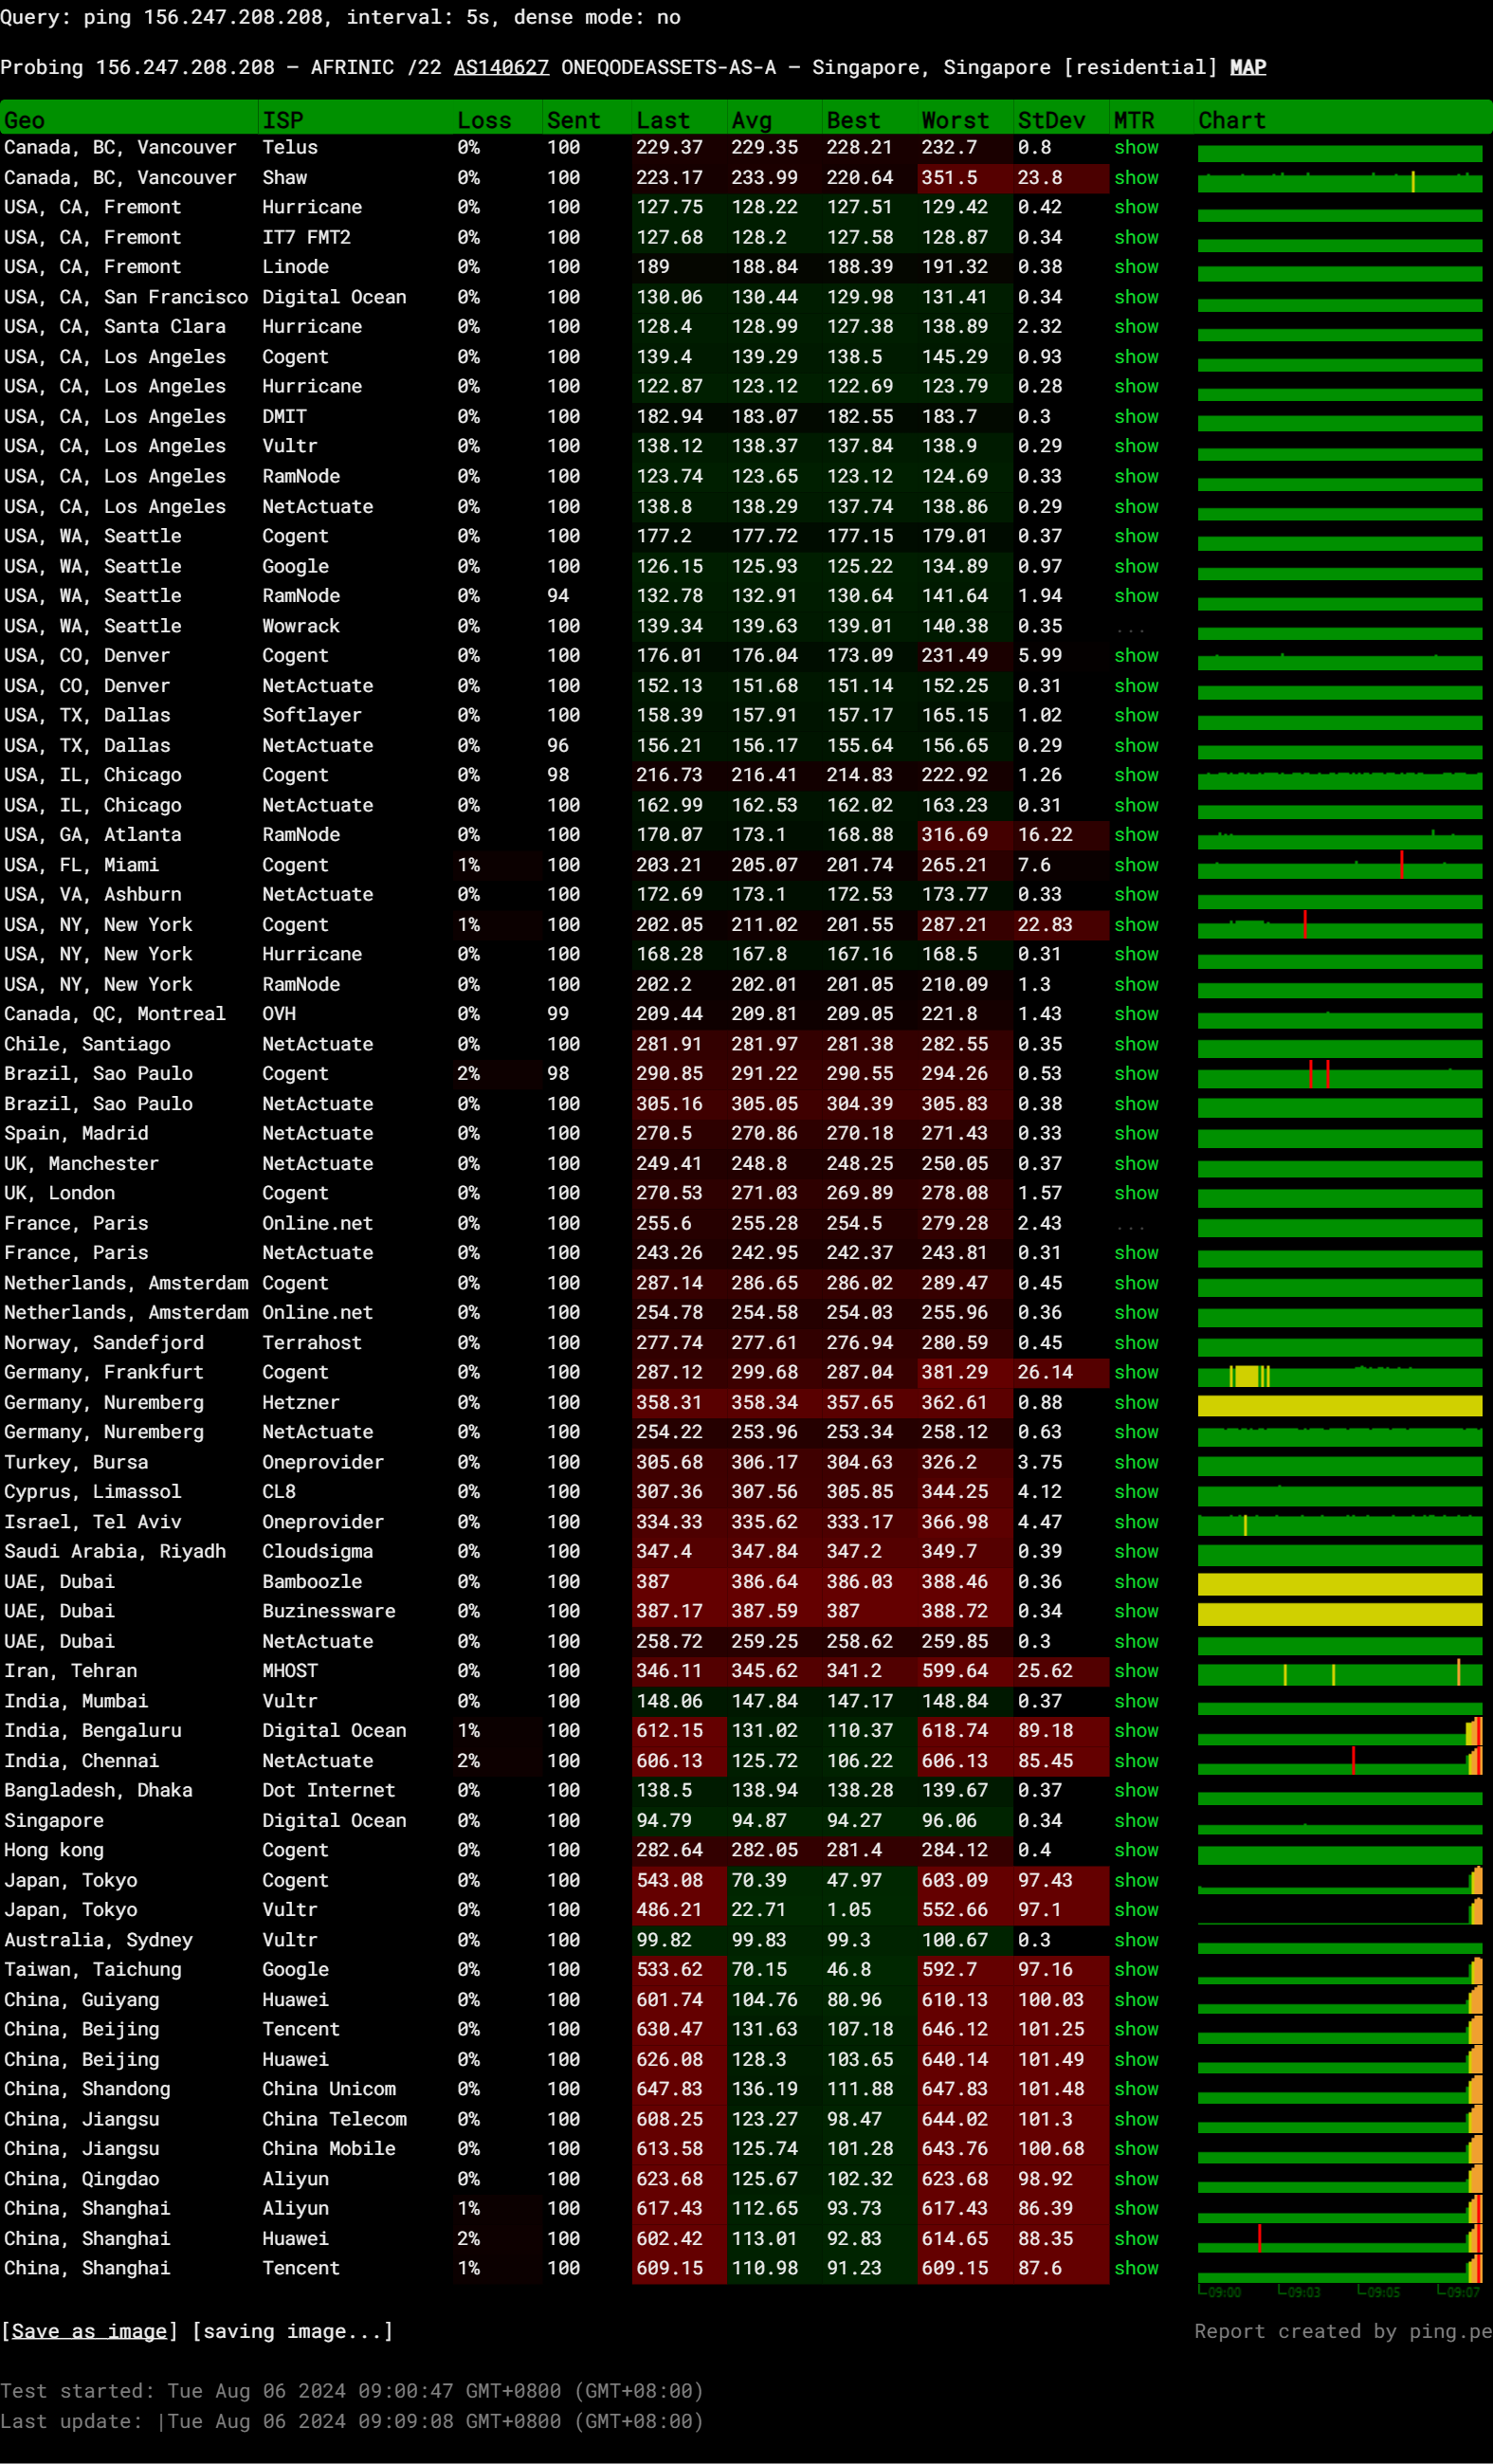
Query: ping 156.247.208.208, interval: 5s, dense mode: no
Probing 156.247.208.208 – AFRINIC /22 AS140627 ONEQODEASSETS-AS-A – Singapore, Singapore [residential]
Global Node Test
 ## CDN Speedtest

 CacheFly : 199.03 KiB/s |    1.55 Mbps  | ping  99.060ms
 Gdrive   :   2.39 KiB/s |    0.02 Mbps  | ping 118.771ms


 ## North America Speedtest

 Softlayer, Washington, USA : 109.16 KiB/s |    0.85 Mbps  | ping 178.934ms
 SoftLayer, San Jose, USA   :       0 B/s |      N/A       | ping error!
 Vultr, New Jersey, USA     : 193.32 KiB/s |    1.51 Mbps  | ping 215.400ms
 Vultr, Seattle, USA        : 194.03 KiB/s |    1.52 Mbps  | ping 170.977ms
 Vultr, Dallas, USA         : 193.67 KiB/s |    1.51 Mbps  | ping 167.931ms
 Vultr, Los Angeles, USA    : 192.00 KiB/s |    1.50 Mbps  | ping 401.770ms
 Ramnode, New York, USA     : 156.54 KiB/s |    1.22 Mbps  | ping 734.695ms
 Ramnode, Atlanta, USA      : 169.31 KiB/s |    1.32 Mbps  | ping 167.941ms


 ## Europe Speedtest

 Vultr, London, UK            : 174.23 KiB/s |    1.36 Mbps  | ping 253.973ms
 LeaseWeb, Frankfurt, Germany :  18.12 KiB/s |    0.14 Mbps  | ping 292.534ms
 Hetzner, Germany             :     112 B/s |      N/A       | ping 357.516ms
 Ramnode, Alblasserdam, NL    : 167.90 KiB/s |    1.31 Mbps  | ping 789.549ms
 Vultr, Amsterdam, NL         : 161.14 KiB/s |    1.26 Mbps  | ping 255.040ms
 EDIS, Stockholm, Sweden      :     290 B/s |      N/A       | ping 274.865ms
 OVH, Roubaix, France         :     290 B/s |      N/A       | ping 275.381ms
 Online, France               : 171.78 KiB/s |    1.34 Mbps  | ping 789.147ms
 Prometeus, Milan, Italy      :     181 B/s |      N/A       | ping 275.711ms


 ## Exotic Speedtest

 Sydney, Australia     : 200.04 KiB/s |    1.56 Mbps  | ping 410.319ms
 Lagoon, New Caledonia :     777 B/s |      N/A       | ping 125.080ms
 Hosteasy, Moldova     : 138.91 KiB/s |    1.09 Mbps  | ping 824.931ms
 Prima, Argentina      : 127.94 KiB/s |    1.00 Mbps  | ping error!


 ## Asia Speedtest

 SoftLayer, Singapore : 152.71 KiB/s |    1.19 Mbps  | ping 618.780ms
 Linode, Tokyo, Japan : 188.05 KiB/s |    1.47 Mbps  | ping 476.282ms
 Linode, Singapore    : 214.22 KiB/s |    1.67 Mbps  | ping  79.739ms
 Vultr, Tokyo, Japan  : 165.30 KiB/s |    1.29 Mbps  | ping 550.836ms


 Benchmark finished in 128 seconds
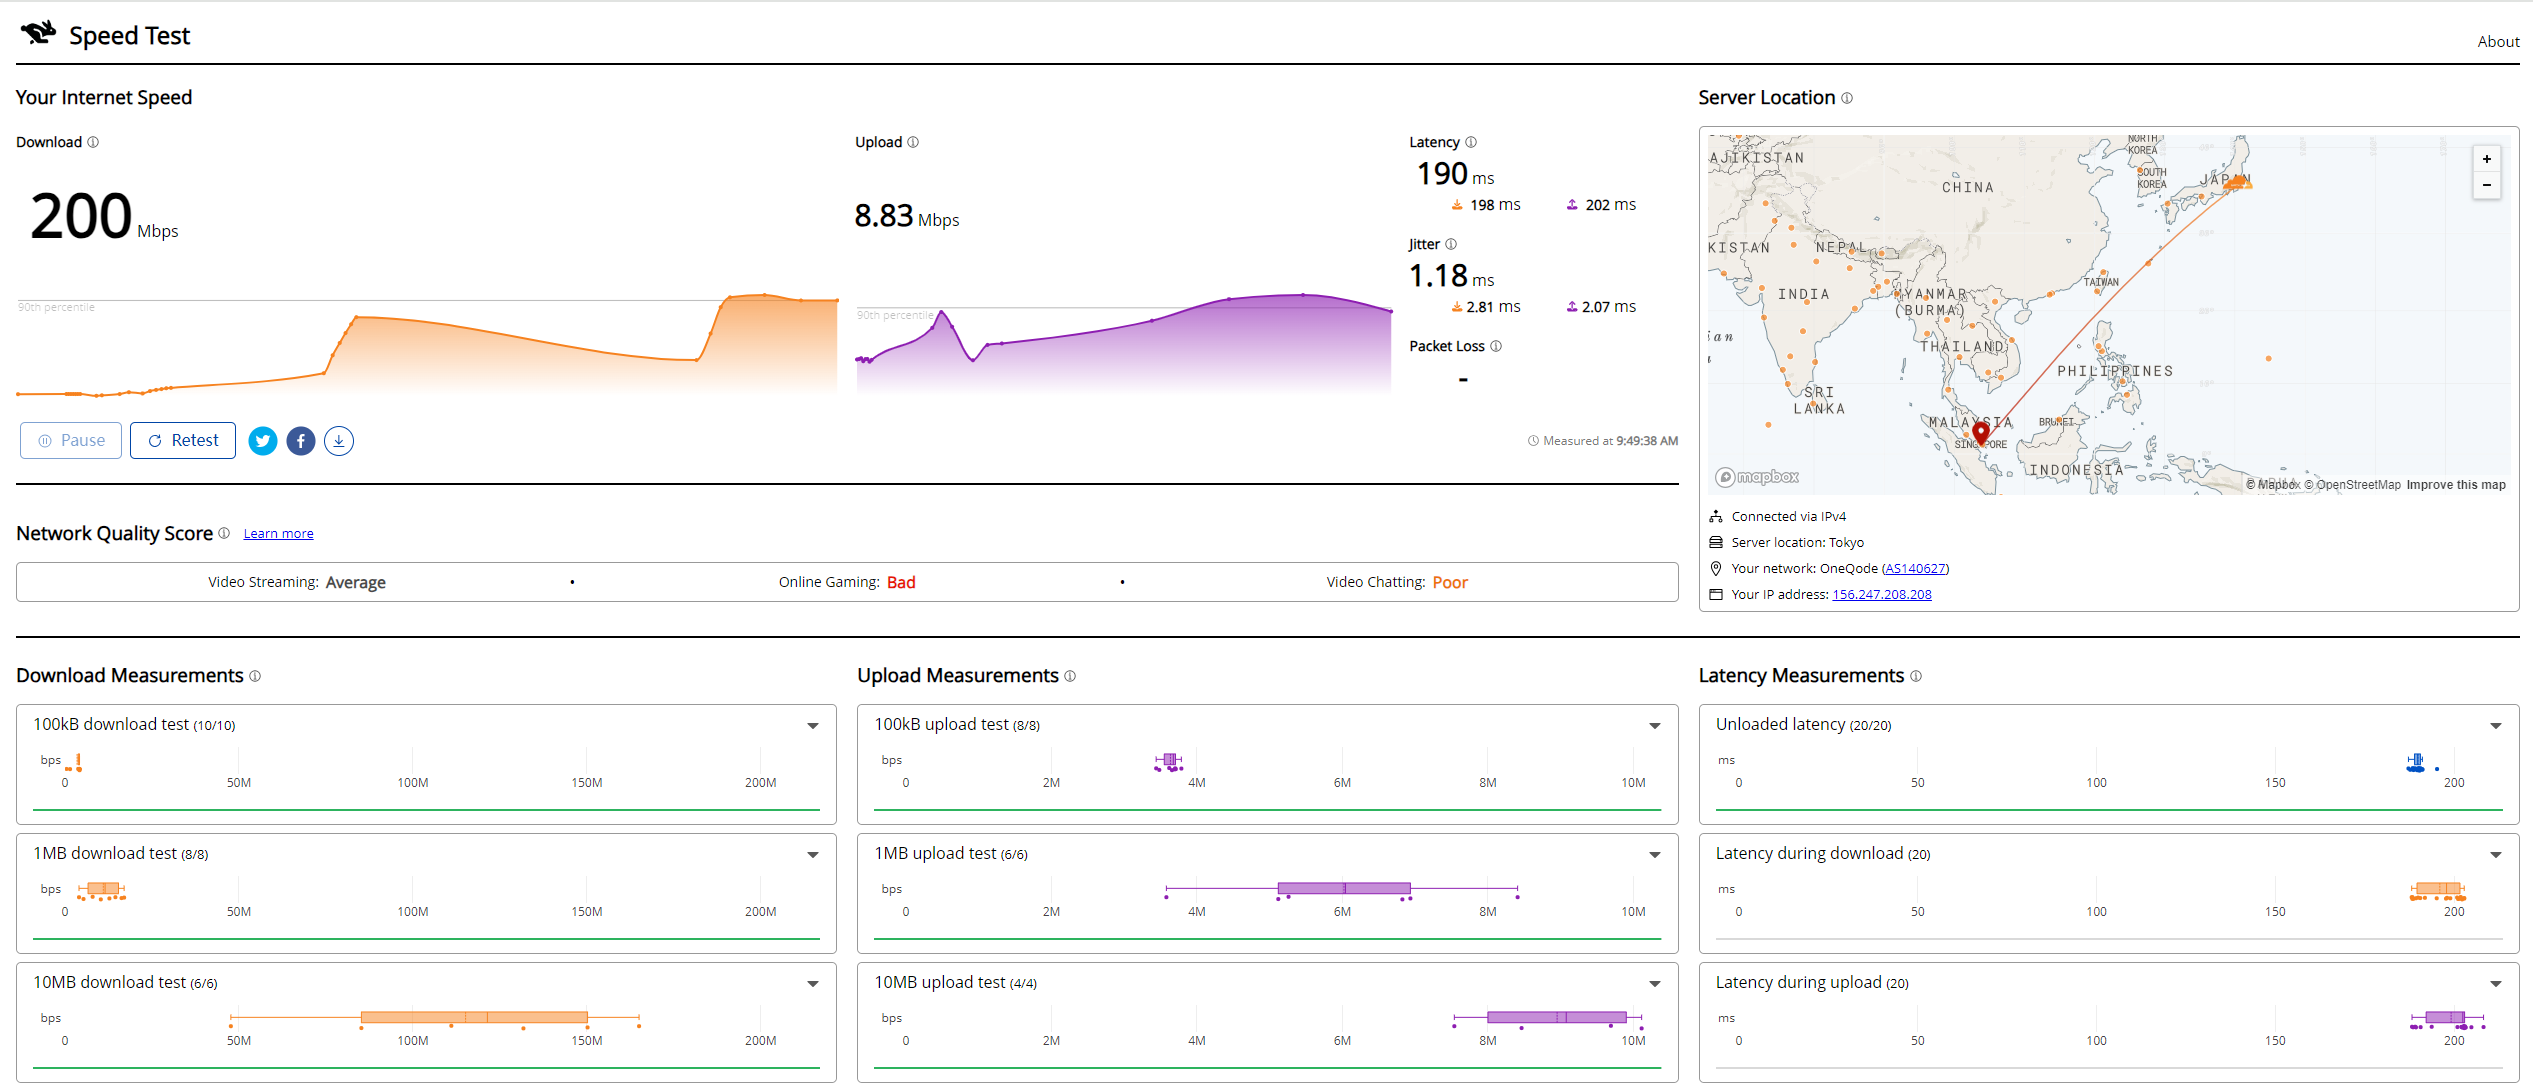
CloudFlare Internet Test
PageSpeed Insights
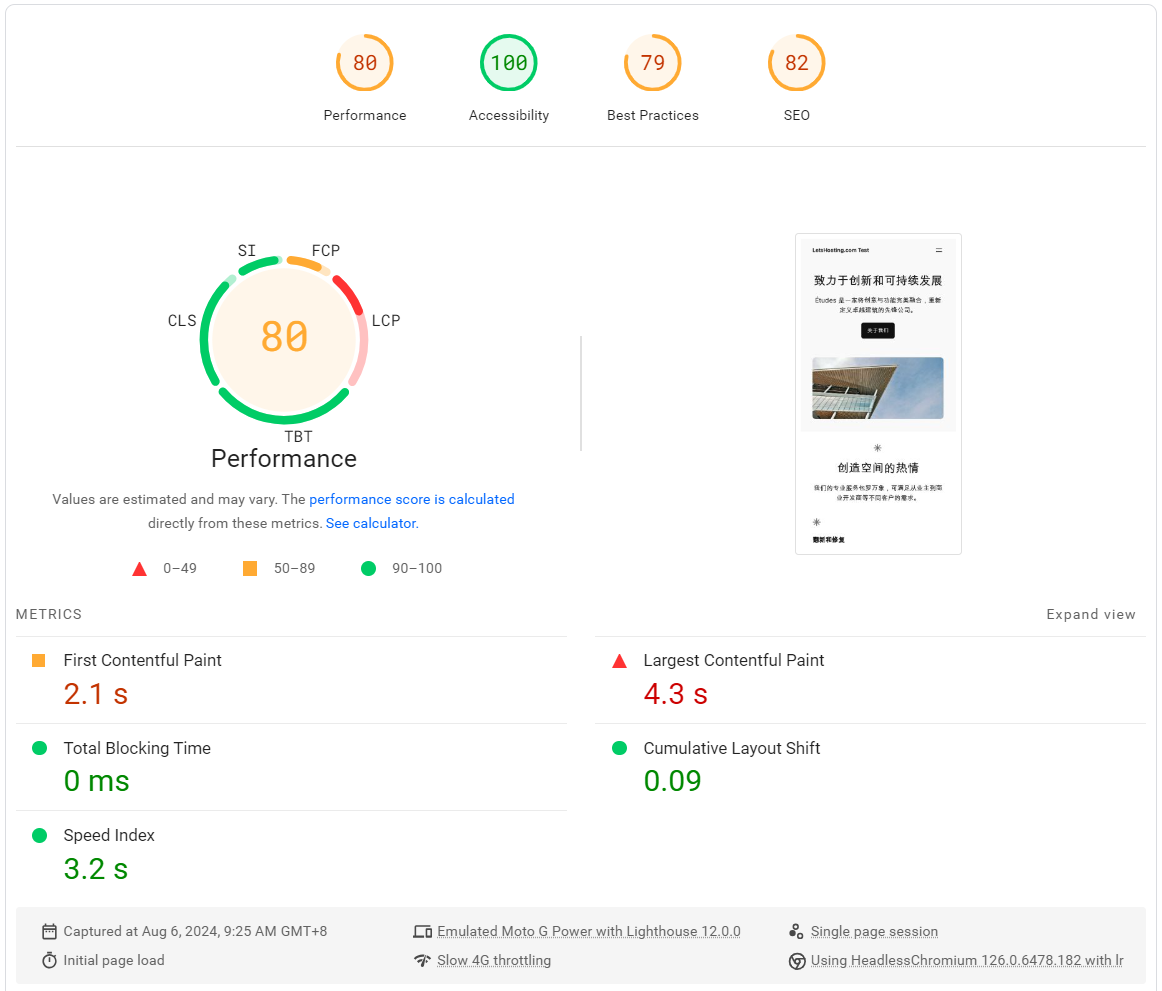
GTmetrix Performance
Media Unlock Test
============[ Multination ]============
 Dazn:                                  Yes (Region: SG)
 Disney+:                               Yes (Region: SG)
 Netflix:                               Yes (Region: SG)
 YouTube Premium:                       Yes (Region: JP)
 Amazon Prime Video:                    Yes (Region: SG)
 TVBAnywhere+:                          Yes
 Spotify Registration:                  No
 Instagram Licensed Audio:              Yes
 OneTrust Region:                       SG [Unknown]
 iQyi Oversea Region:                   SG
 Bing Region:                           SG
 YouTube CDN:                           Los Angeles, CA
 Netflix Preferred CDN:                 Failed (CDN IP Not Found)
 ChatGPT:                               Yes
 Google Gemini:                         Yes (Region: JPN)
 Wikipedia Editability:                 Yes
 Google Search CAPTCHA Free:            Yes
 Steam Currency:                        SGD
 ---Forum---
 Reddit:                                Yes
=======================================
Admin Control Panel
Server Pricing
Official Website: https://www.OneQode.com
Coupon
The merchant did not provide
Conclusion
In our Basic Benchmark, the I/O speed averaged 110.3 MB/s, below the acceptable threshold. Network tests showed varied results: while local speeds in Tokyo were excellent (upload at 871.77 Mbps and download at 941.19 Mbps), speeds to other global nodes like Los Angeles and Amsterdam were slower, though still decent. Notably, connections to Chongqing were very poor.
The Yabs performance test highlighted moderate disk speeds, with mixed read/write speeds around 107 MB/s for 4k blocks and 217 MB/s for 64k blocks. These results suggest the server’s storage performance is on the lower side, impacting tasks that require frequent disk access.
In the Geekbench 6 test, the server scored 1653 for single-core and 2926 for multi-core performance. These scores are good, indicating the server handles computational tasks effectively. The UnixBench test further confirmed this, with impressive CPU and file copy test results, showing strong performance under load.
In conclusion, the OneQode Japan Tokyo server offers robust CPU performance and excellent local network speeds. However, its I/O speed is lacking, and network performance varies significantly based on location. This server suits CPU-intensive tasks but may struggle with high I/O demands.
Official Website: https://www.OneQode.com


